Chart
Rival One’s Chart component can be used to chart any Equity or Future instrument supported by Rival One. Using the same criteria as in Main Search or other components within the Rival One application, users can search for any Symbol to be displayed in the Chart.
Users may add as many Symbols as desired per Chart, with each new Symbol appearing in its own tab. Note, however, that only one Chart component may be added per workspace window.
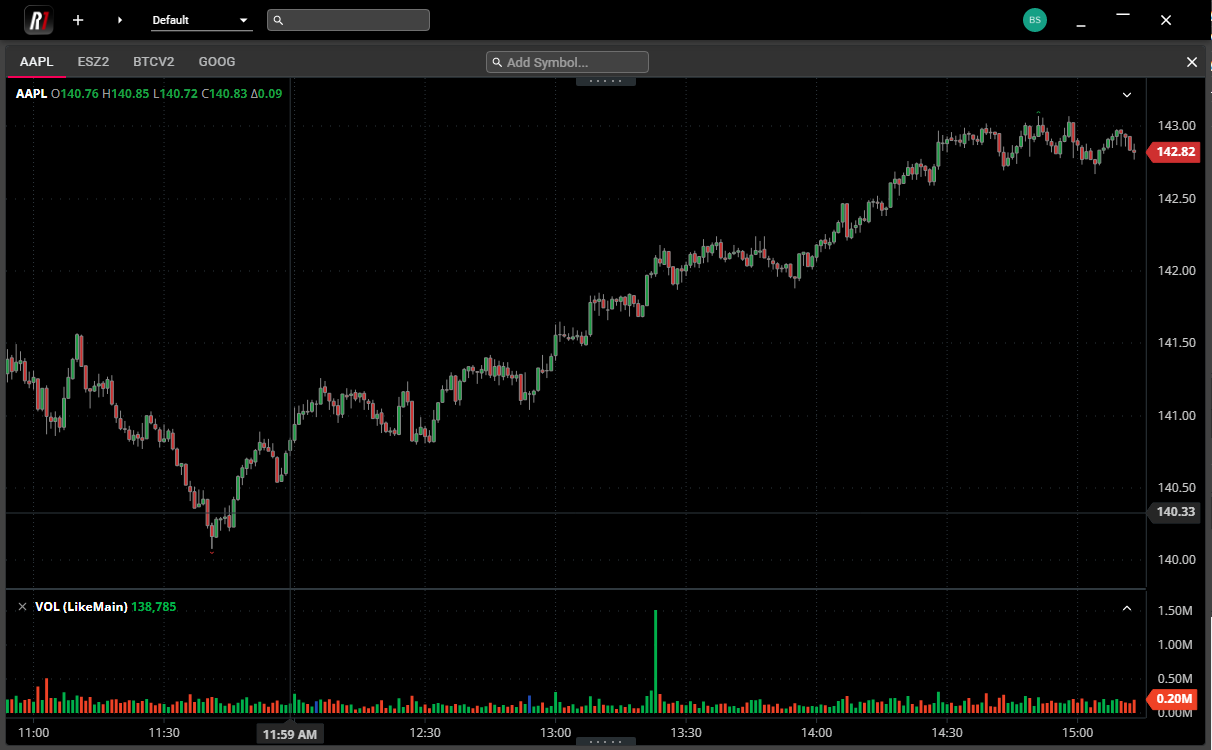
Chart Features
Chart component offers highly customizable charting capabilities, including different plot types, comparison charts between multiple products, dozens of studies, and customizable expressions, in order to chart any synthetic instrument, based on the user’s specific formula.
Display
Right-click anywhere within the boundaries of an existing Chart in order to access all customizable display features, such as Time Interval, Plot Type and Studies.
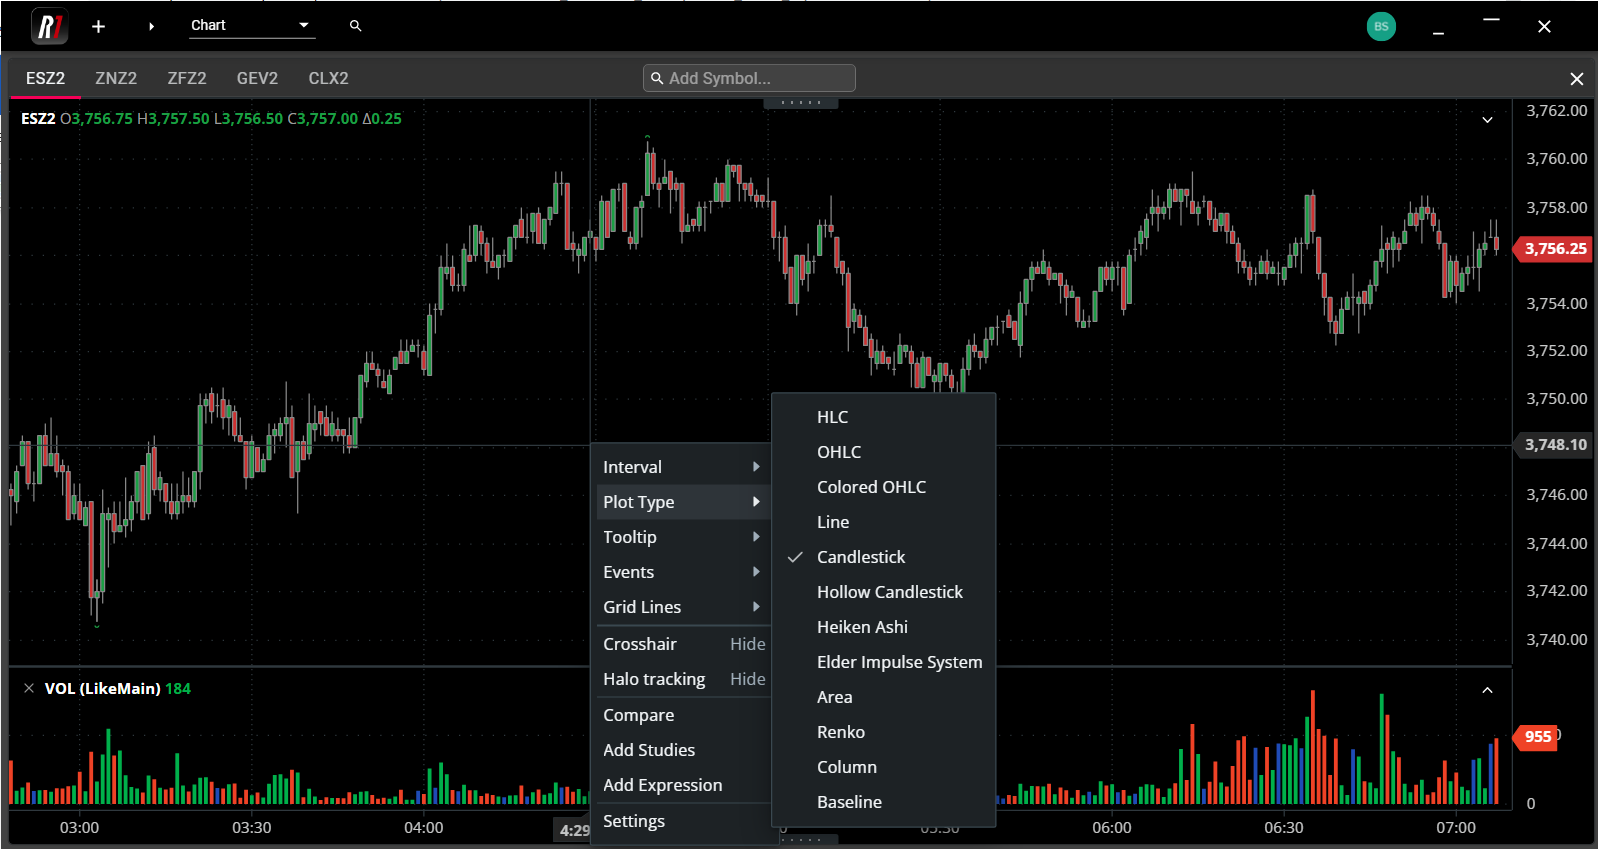
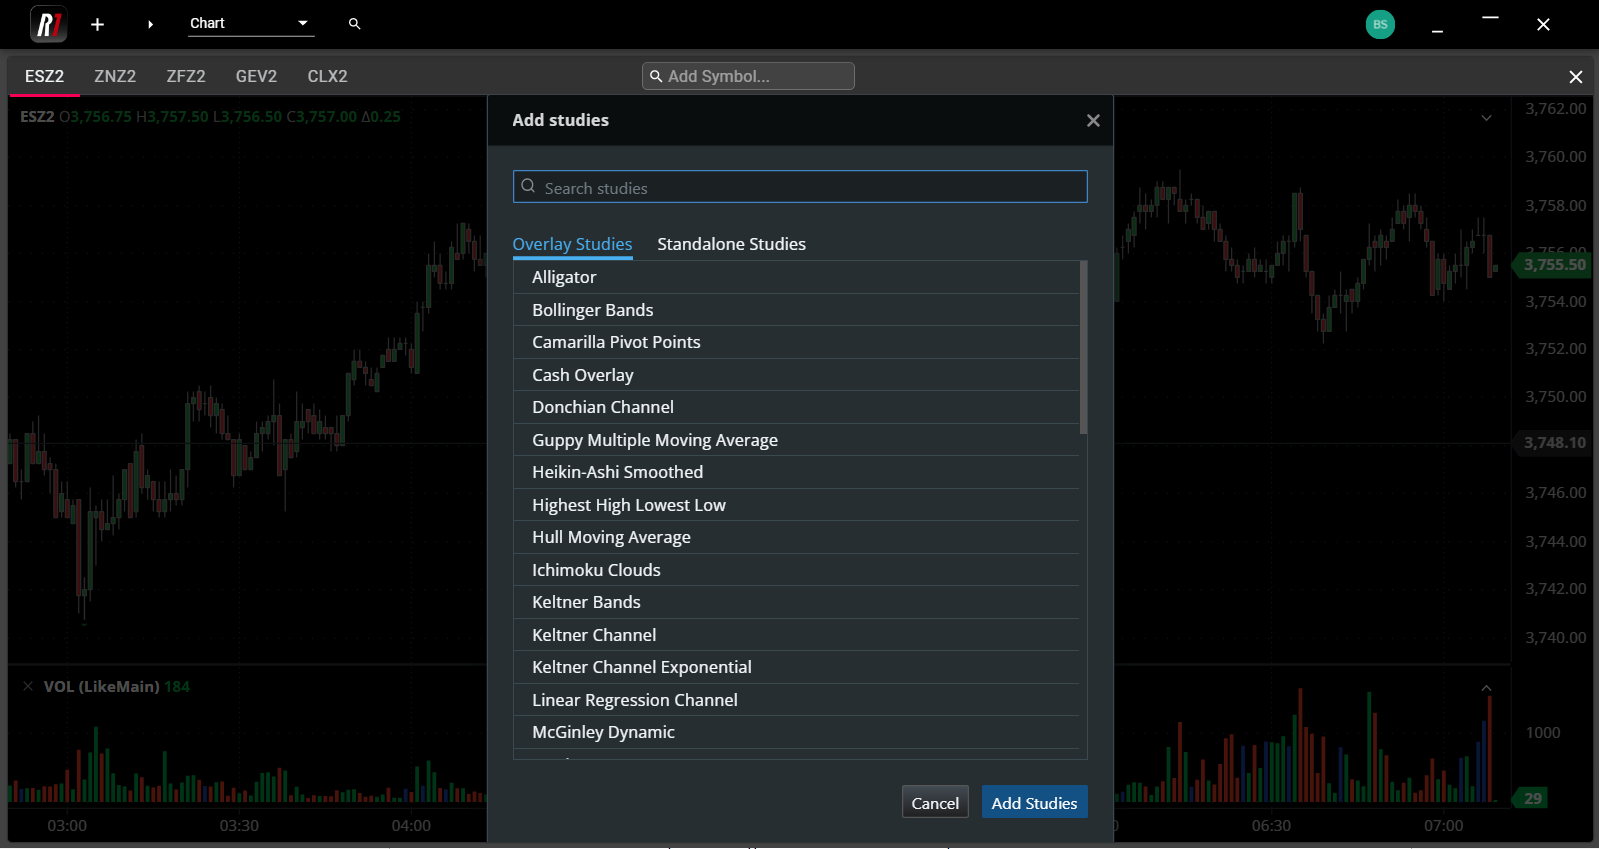
Any change to the display will affect only the Chart tab in focus, so users may view different Chart types, intervals and studies within separate component tabs. All selections are retained within the component and within the workspace through a restart and over multiple trade sessions.
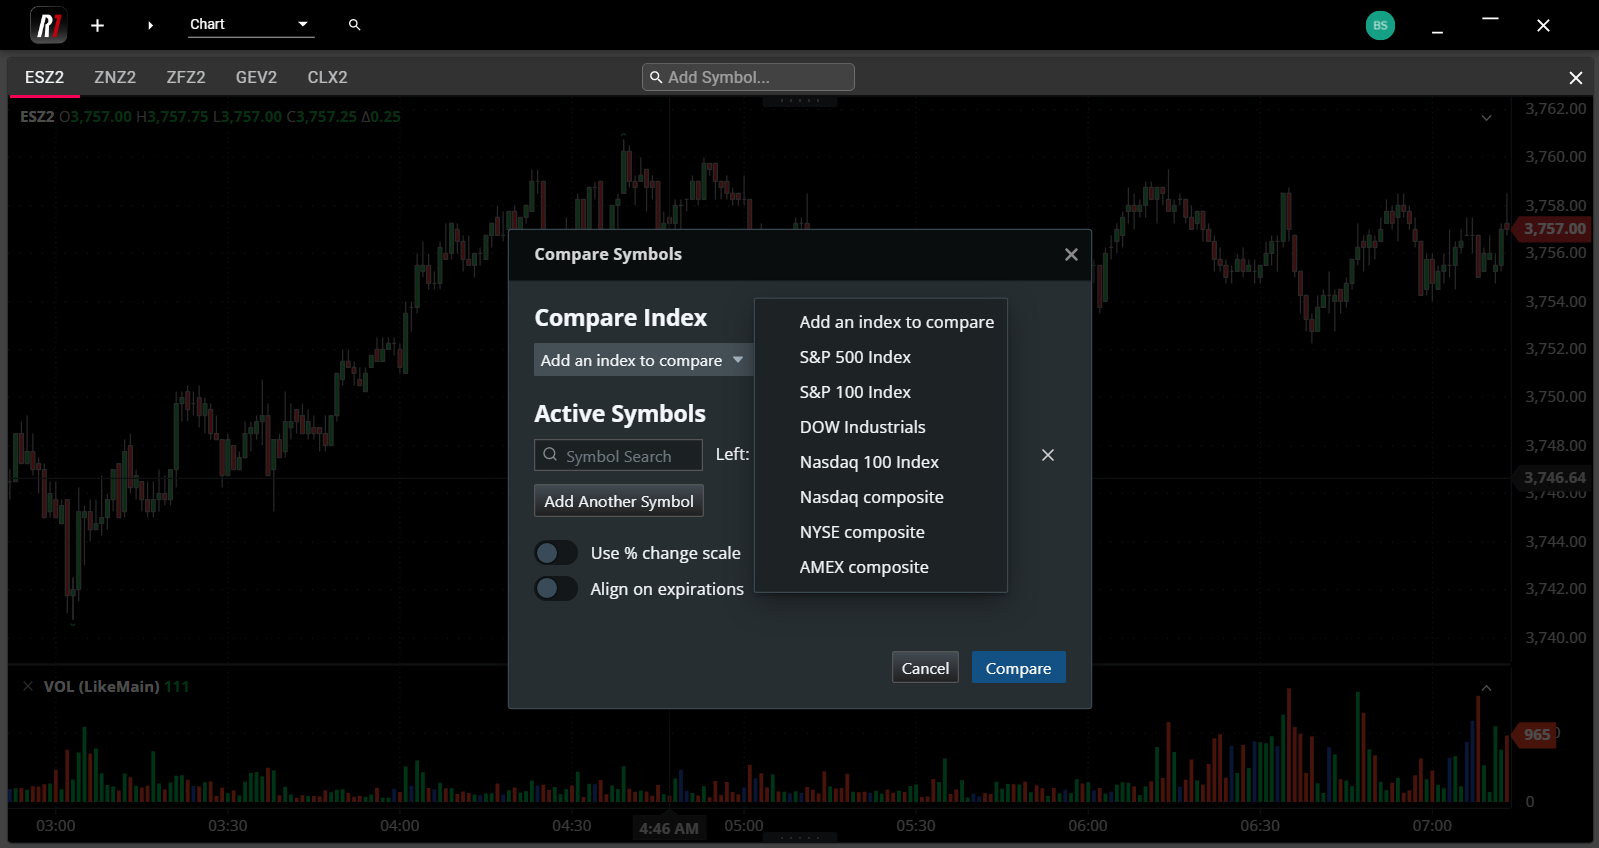
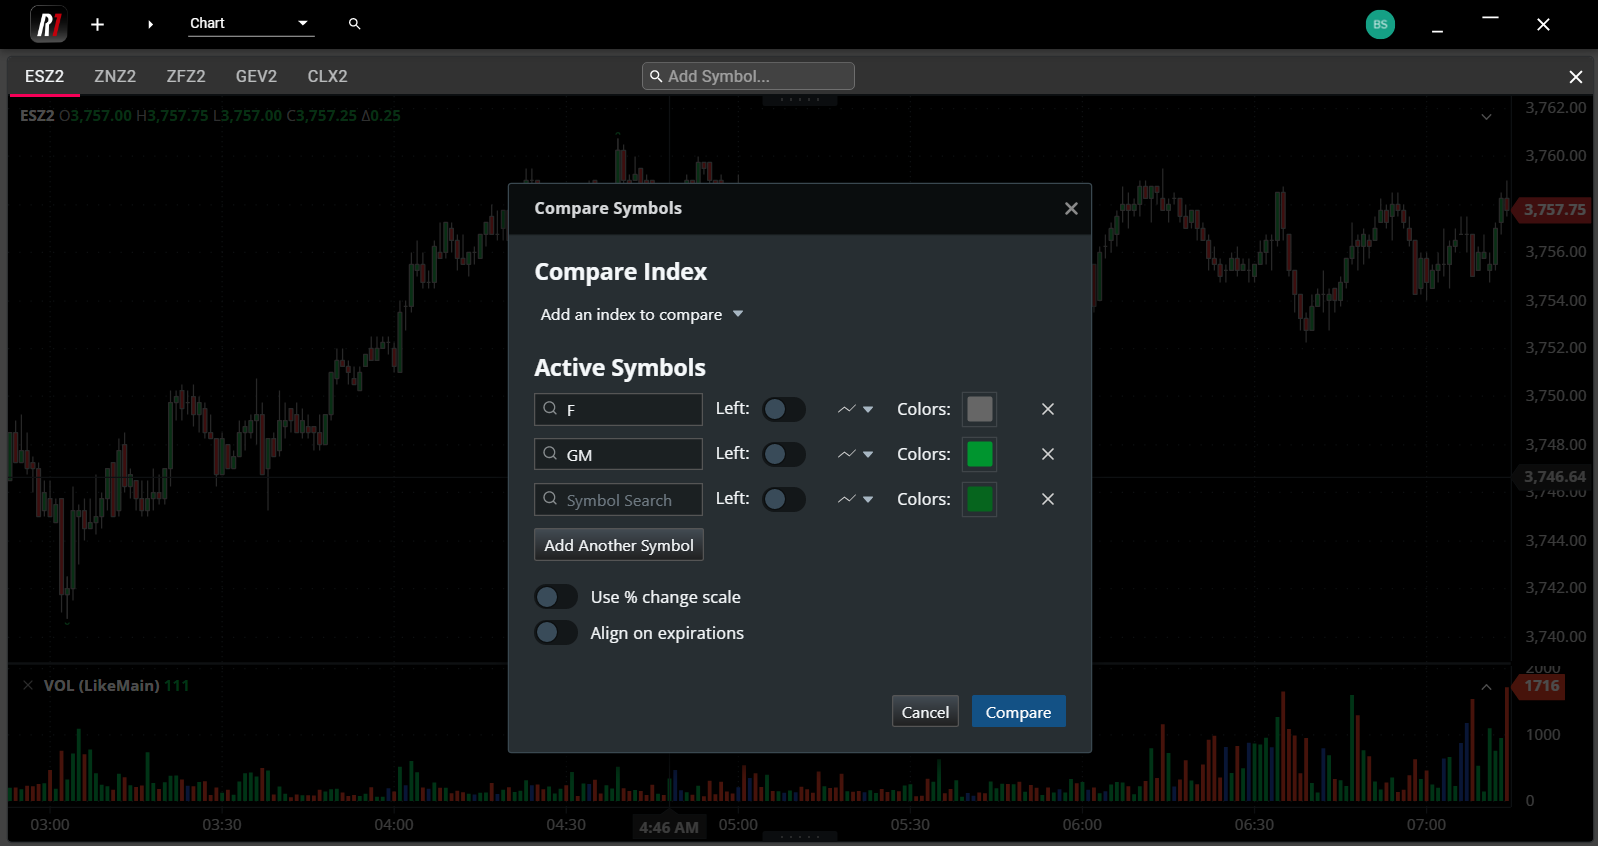
Comparisons
Users may view multiple Symbols within the same Chart tab by using the Compare feature, accessible from the right-click menu. Several indexes are pre-configured for comparison, or users may add one or more individual symbols through the Active Symbols input.
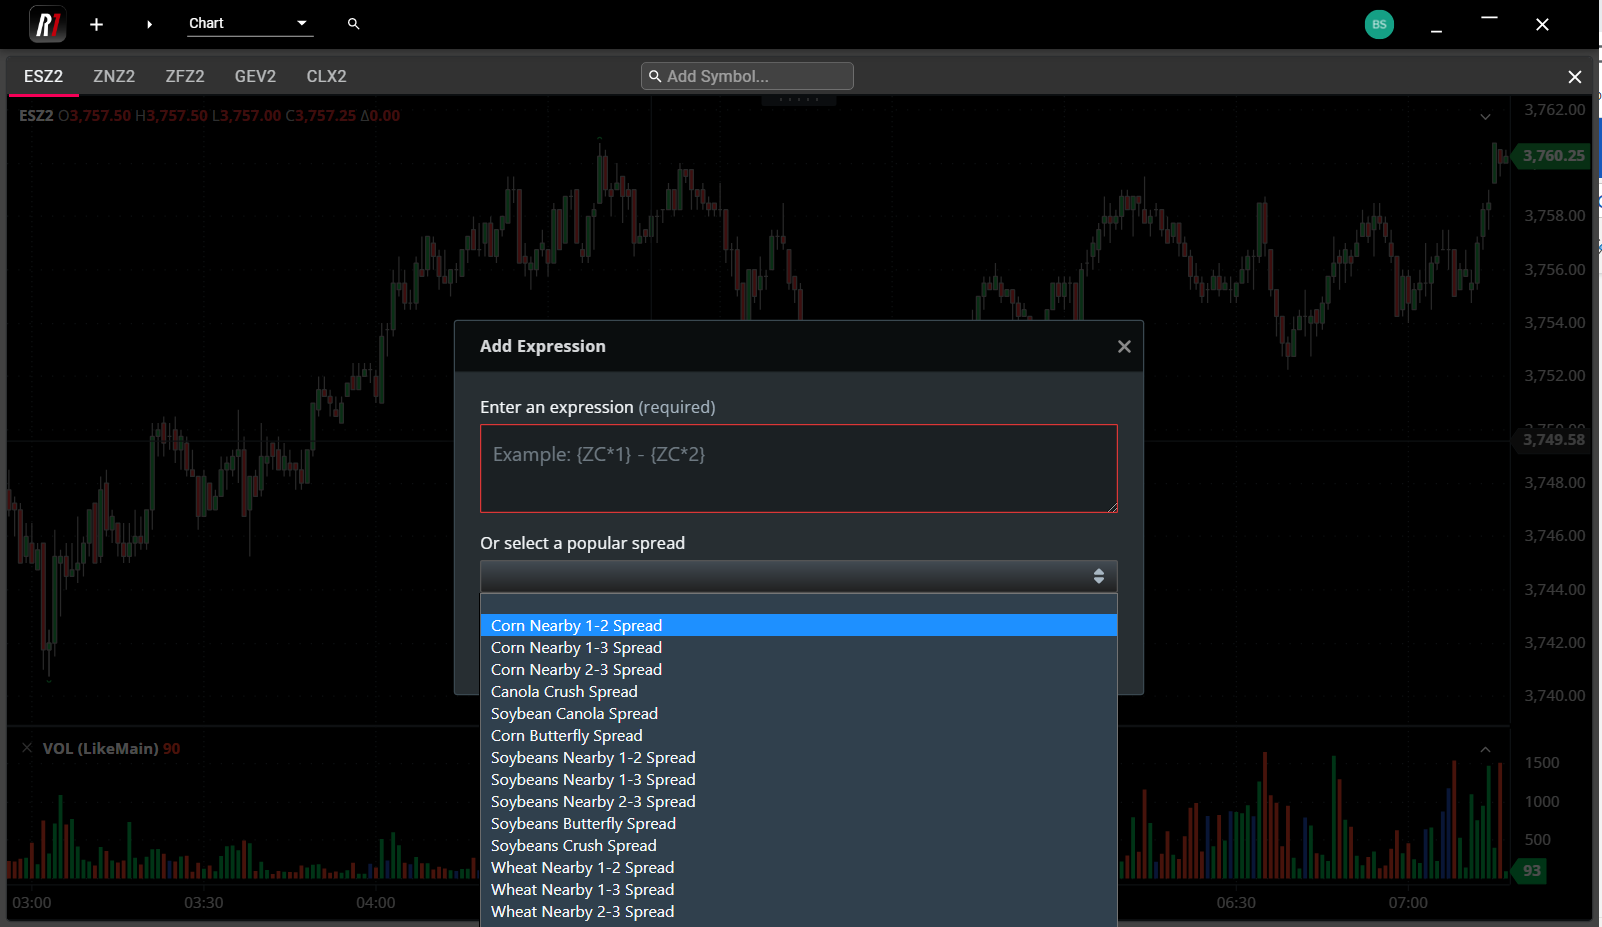
Custom Formulas and Expressions
Users may further customize their viewable instruments within Chart by using the Expression selection from the right-click menu. In addition to commonly monitored spreads, users can enter their own formula in order to display custom synthetic instruments.