Ticker
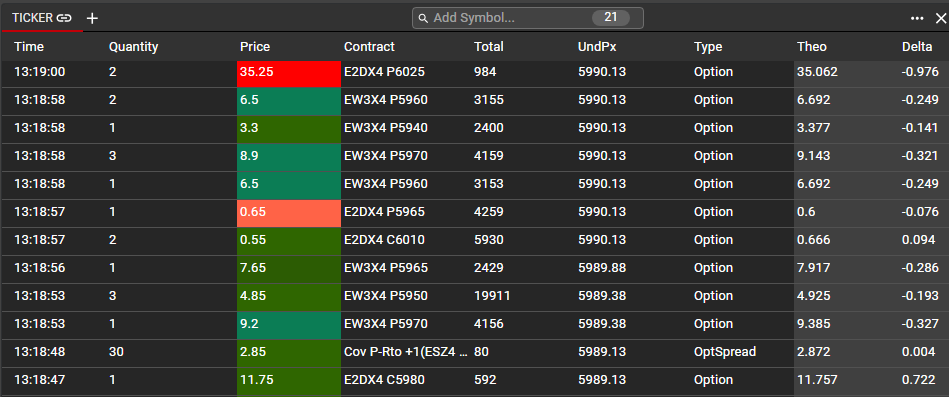
The Ticker component is used to monitor all trading activity within a specified Symbol or across multiple Symbols. In order to add a Symbol to the Ticker, use the Search feature at the top of the component. Using the same search criteria as in the Main Search or in other workspace components, users will select the symbol to monitor. Once a Symbol has been selected, users will see real-time data displayed in the ticker, with the time of the trade, the trade quantity and price, and the total volume for the current trading session.
Adding Multiple Symbols
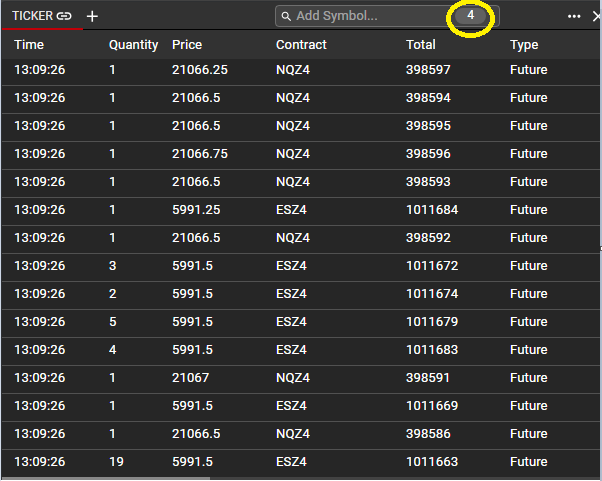
Once a Symbol has been added, users may use the Search tool again to add another Symbol. Users may add as many symbols as desired into one Ticker window, and all trade activity will be displayed strictly chronologically for all Symbols selected.
The Search input will display the total number of Symbols selected for the Ticker window.
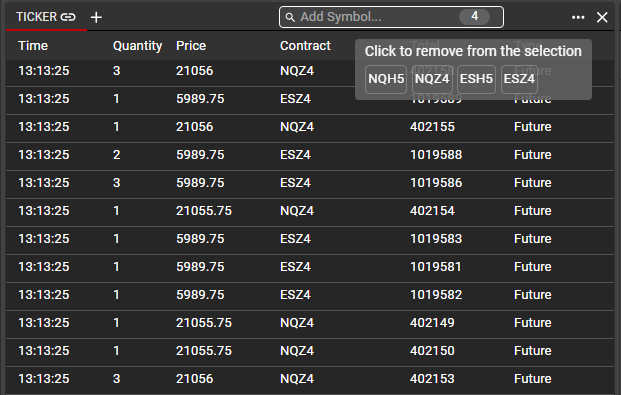
Hovering over this number will display the selected symbols. In order to remove a Symbol, hover over the number to display all symbols and click on the individual Symbol to be removed. Any removed Symbols may be added back at any time.
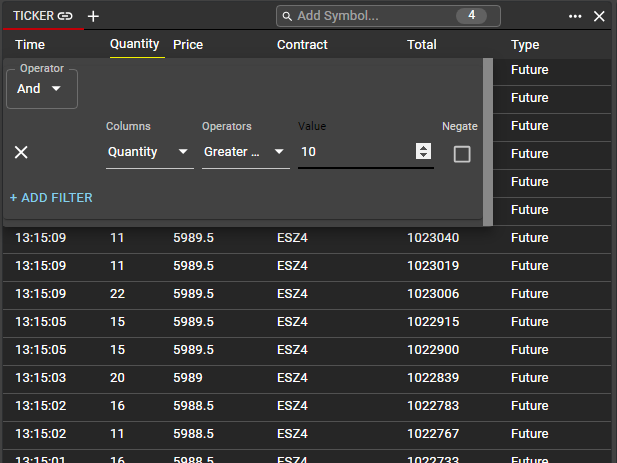
Using Filters in Ticker
When adding a Symbol to Ticker, any and all trade activity for that Symbol will be displayed. For a more refined display, users may apply filters in order to display only the trades meeting the user’s specified criteria. Most commonly, filters may be used to restrict displayed trades by trade quantity.
As with other components, filters may be applied from the ellipsis menu, and users may specify an and/or condition for each set of filters.
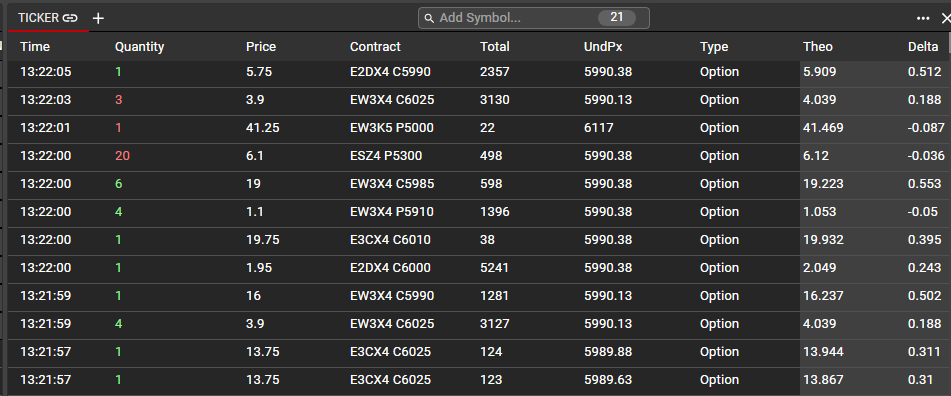
Additional Data in Ticker
Users have the ability to apply heat mapping to Ticker for options and option spreads. Heat mapping will show how far the instrument's traded price is above (red highlight) or below (green highlight) the theoretical value. As in Option Chain, the red and green highlights will darken the further the value is from theo. This setting can be enabled or disabled from the Ticker menu.
Display of aggressor is also available and can be enabled from the Ticker menu. When enabled, the quantity value will be shown in green when the aggressor on a trade is a buyer and red when the aggressor is a seller. This setting can be used in conjunction with heat mapping or can be enabled without heat mapping.