
Vol Graph
The Vol Graph component displays Rival's calculated volatility surface for any option series. Users can view current curve, settlement curve and volatility at each individual strike. Users may also use Vol Graph to view the term structure for a selected option symbol.
Launching Vol Graph
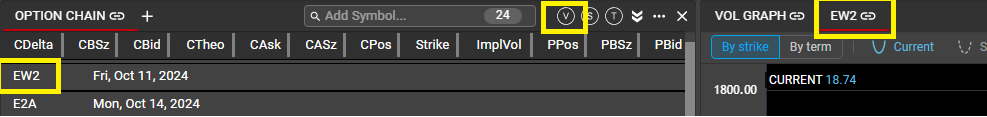
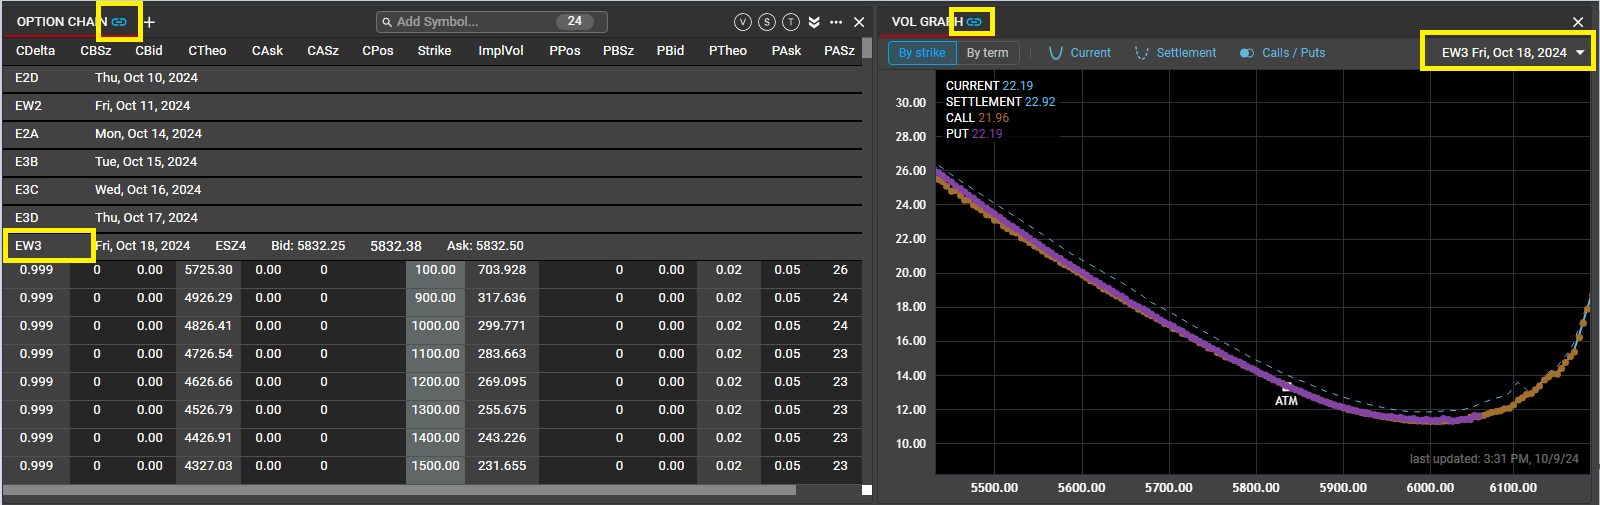
Vol Graph can be opened from any Option Chain, using the 'V' icon from the Option Chain header. Drag the icon to any spot in the workspace to create a new Vol Graph.

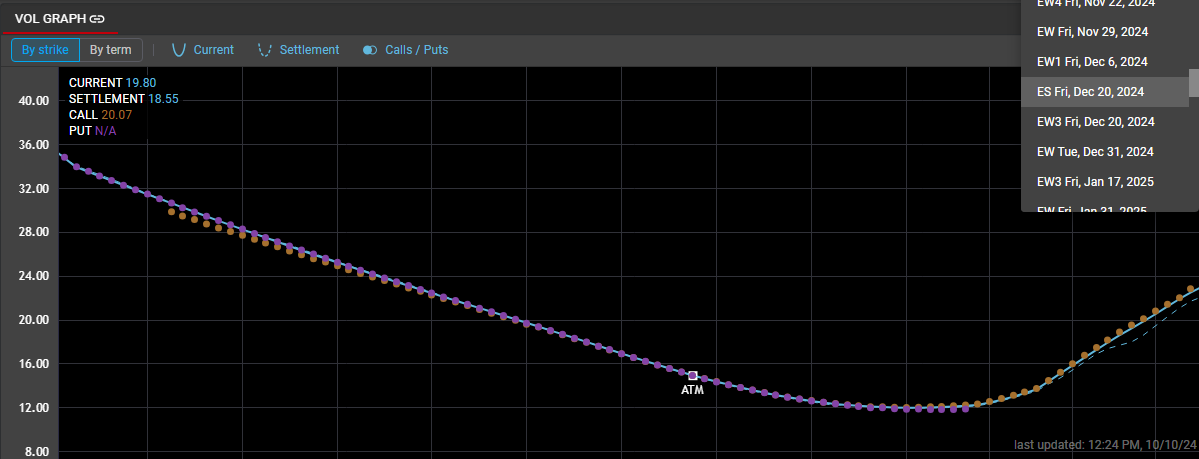
The newly created Vol Graph will have the ability to display the vol curve for any instrument listed in the parent Option Chain. By default, the first listed Term will be displayed, and users can select any other Term from the dropdown menu.
Additional tabs can be created within the same Vol Graph component by dragging the V icon to the Vol Graph header.
Data in Vol Graph
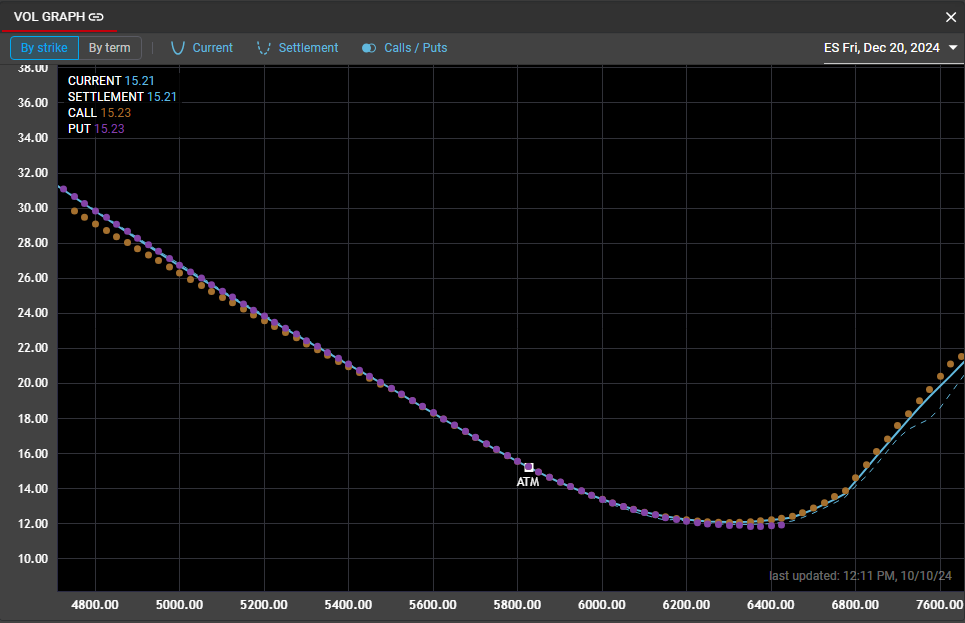
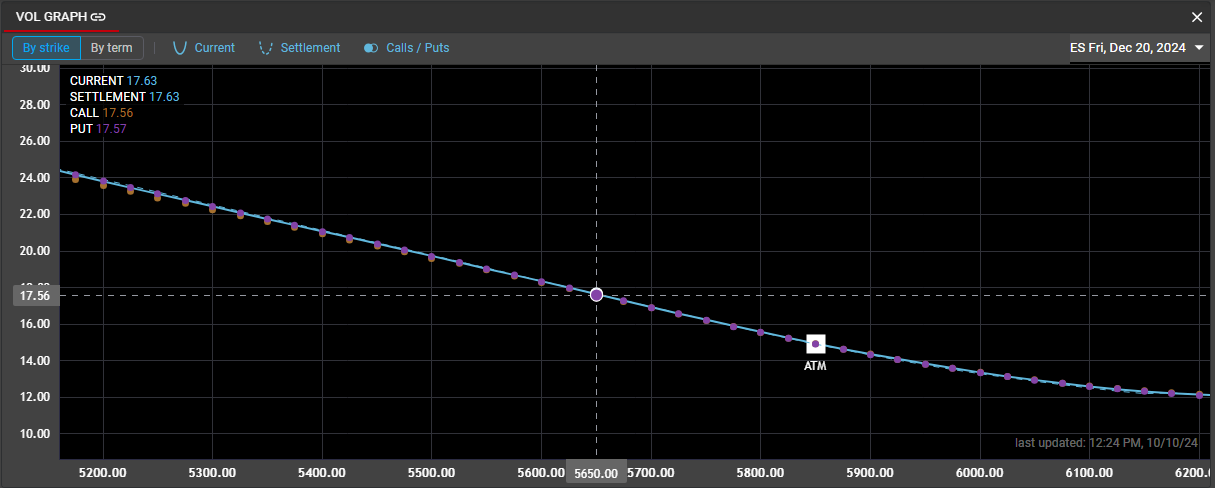
In the 'By Strike' mode, the X-axis of the Vol Graph displays strikes in the selected Term, while the Y-axis displays Rival's calculated implied volatility at each strike. There are three distinct curves that can be exposed at any time by clicking on them in the Vol Graph header.
Current curve displays the last calculated implied volatility at each strike. Rival's autofit curve updates on a regular interval but will also re-calculate with a move in the underlying instrument or in global volatility. The lower right corner of the Vol Graph will display the time of the last calculated curve.
Settlement curve displays Rival's calculated settlement volatility for each strike and is displayed as a dashed line. Note that the calculated settlement volatility is not the volatility that is published by the exchange. Both settlement vol and implied vol are determined based on the autofit curve, to provide a consistent measure of volatility.
Calls/Puts will give a detailed view into the market by displaying the volatility implied by the midmarket price of the call and the put, respectively.
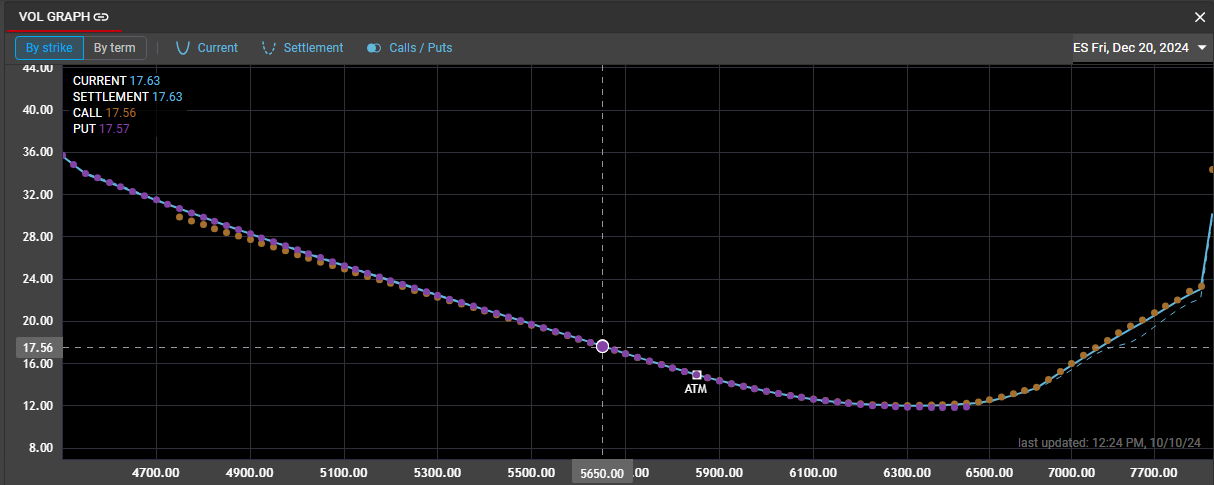
Placing the cursor inside the Vol Graph will expose a crosshairs tool which can help display granular detail at each strike. In the upper left corner of the Vol Graph, the volatility level for each curve is displayed. Users can zoom in on the graph for an enhanced view.
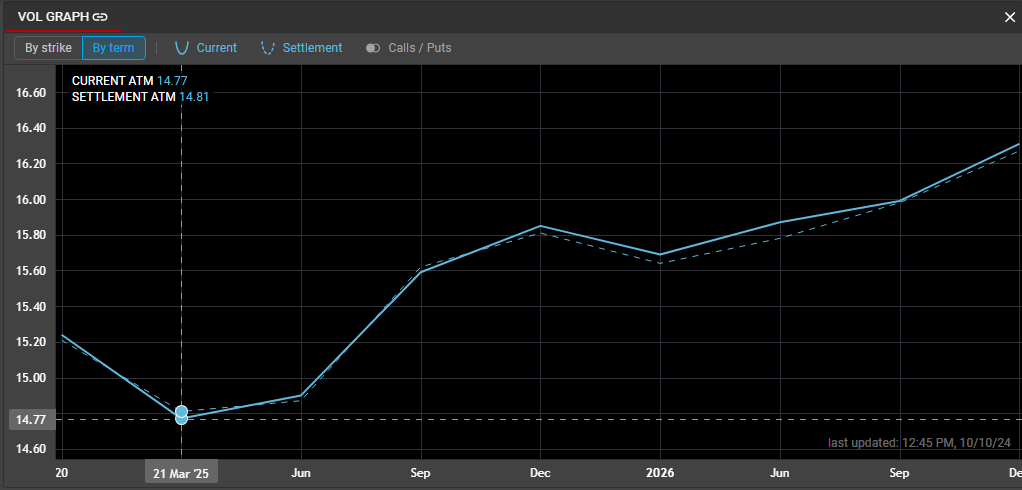
Term Structure
Selecting the 'By Term' mode in Vol Graph will display the at-the-money volatility over all terms for the selected options series. In this mode, the X-axis represents time to expiration, and the Y-axis represents ATM volatility. The same volatility curves (Current, Settlement and Call/Put) are available in the Term Structure.
Linking Vol Graph
Option Chain can be linked to to Vol Graph. Once both components are assigned a linked group, clicking on a term header in the Option Chain will display the Vol Curve for the selected Term. See the Workspace Overview article for more details on component linking.
Charting Attribution
TradingView Lightweight Charts™
Copyright (с) 2025 TradingView, Inc. https://www.tradingview.com/